FLAIR is about to start working on multiple new clients in the next quarter but is unsure if they need to hire new employees, find freelancers or push the start dates further down the year.
SERVICES
Budgeting
Work Planning
Financial Reporting
DELIVERABLES
Costing Grid
Work Mananagement
Time Tracking Reports

Step 1
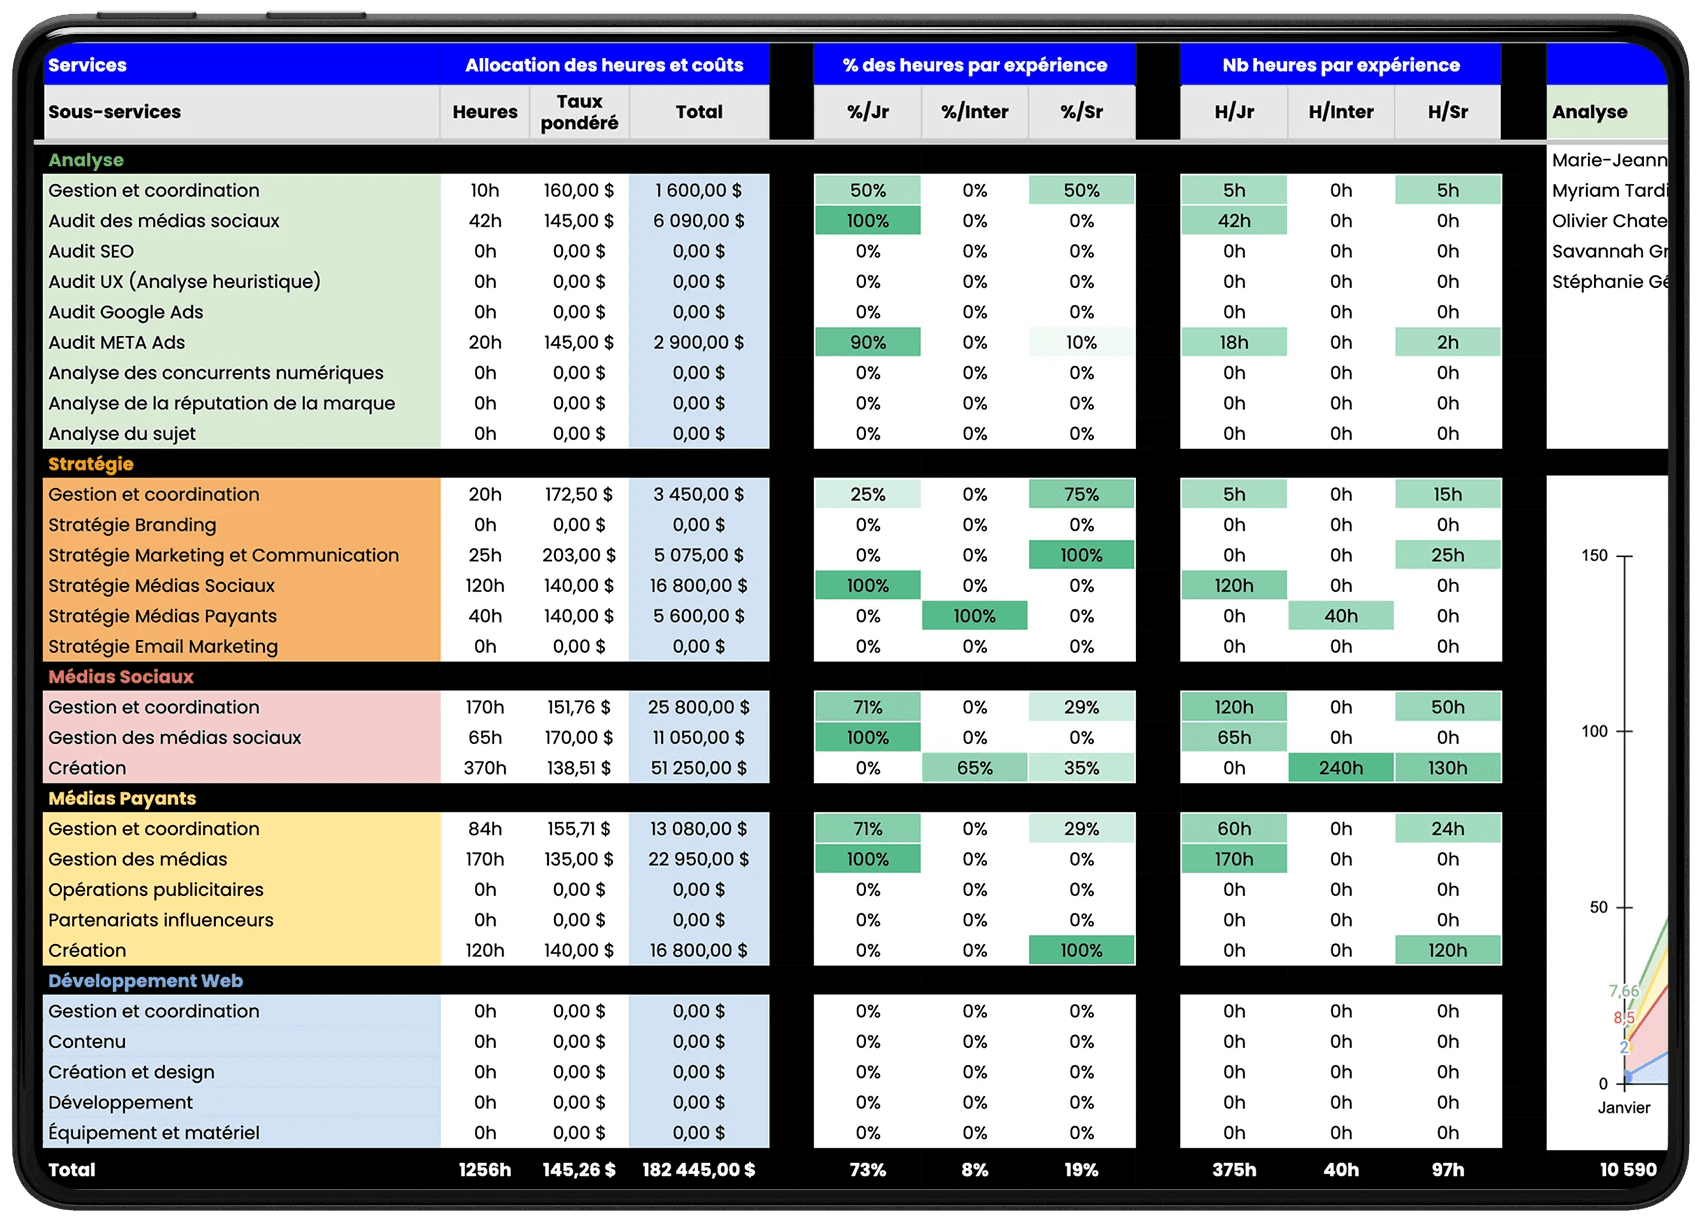
In a service-based business where each project is unique, it's crucial to accurately determine pricing and workload despite efforts to standardize services. To address this, we developed an in-house costing grid for the sales department. This tool provides a detailed breakdown of the tasks involved in each deliverable, offering a clear picture of the work required. Additionally, it forecasts both the revenue generated and the work hours needed throughout the project's duration, ensuring precise cost estimation and resource planning.

Exp. Levels KPIs
Balancing experience levels across projects is essential to maximize both the quality of work produced and the profit margins.
Hours per Discipline
Gaining a detailed view of the work required for each project enables managers to determine the specific types of talent needed to complete the tasks effectively.
Task Creation
The costing grid automatically creates and assigns tasks, facilitating the seamless transfer of this information into a project management tool.
Forecasted Revenue
The costing grid enables the revenue and accounting departments to determine the appropriate billing schedule, while also providing the sales team with insights into whether they will meet their sales and revenue targets.


Step 2
Workload Capacity
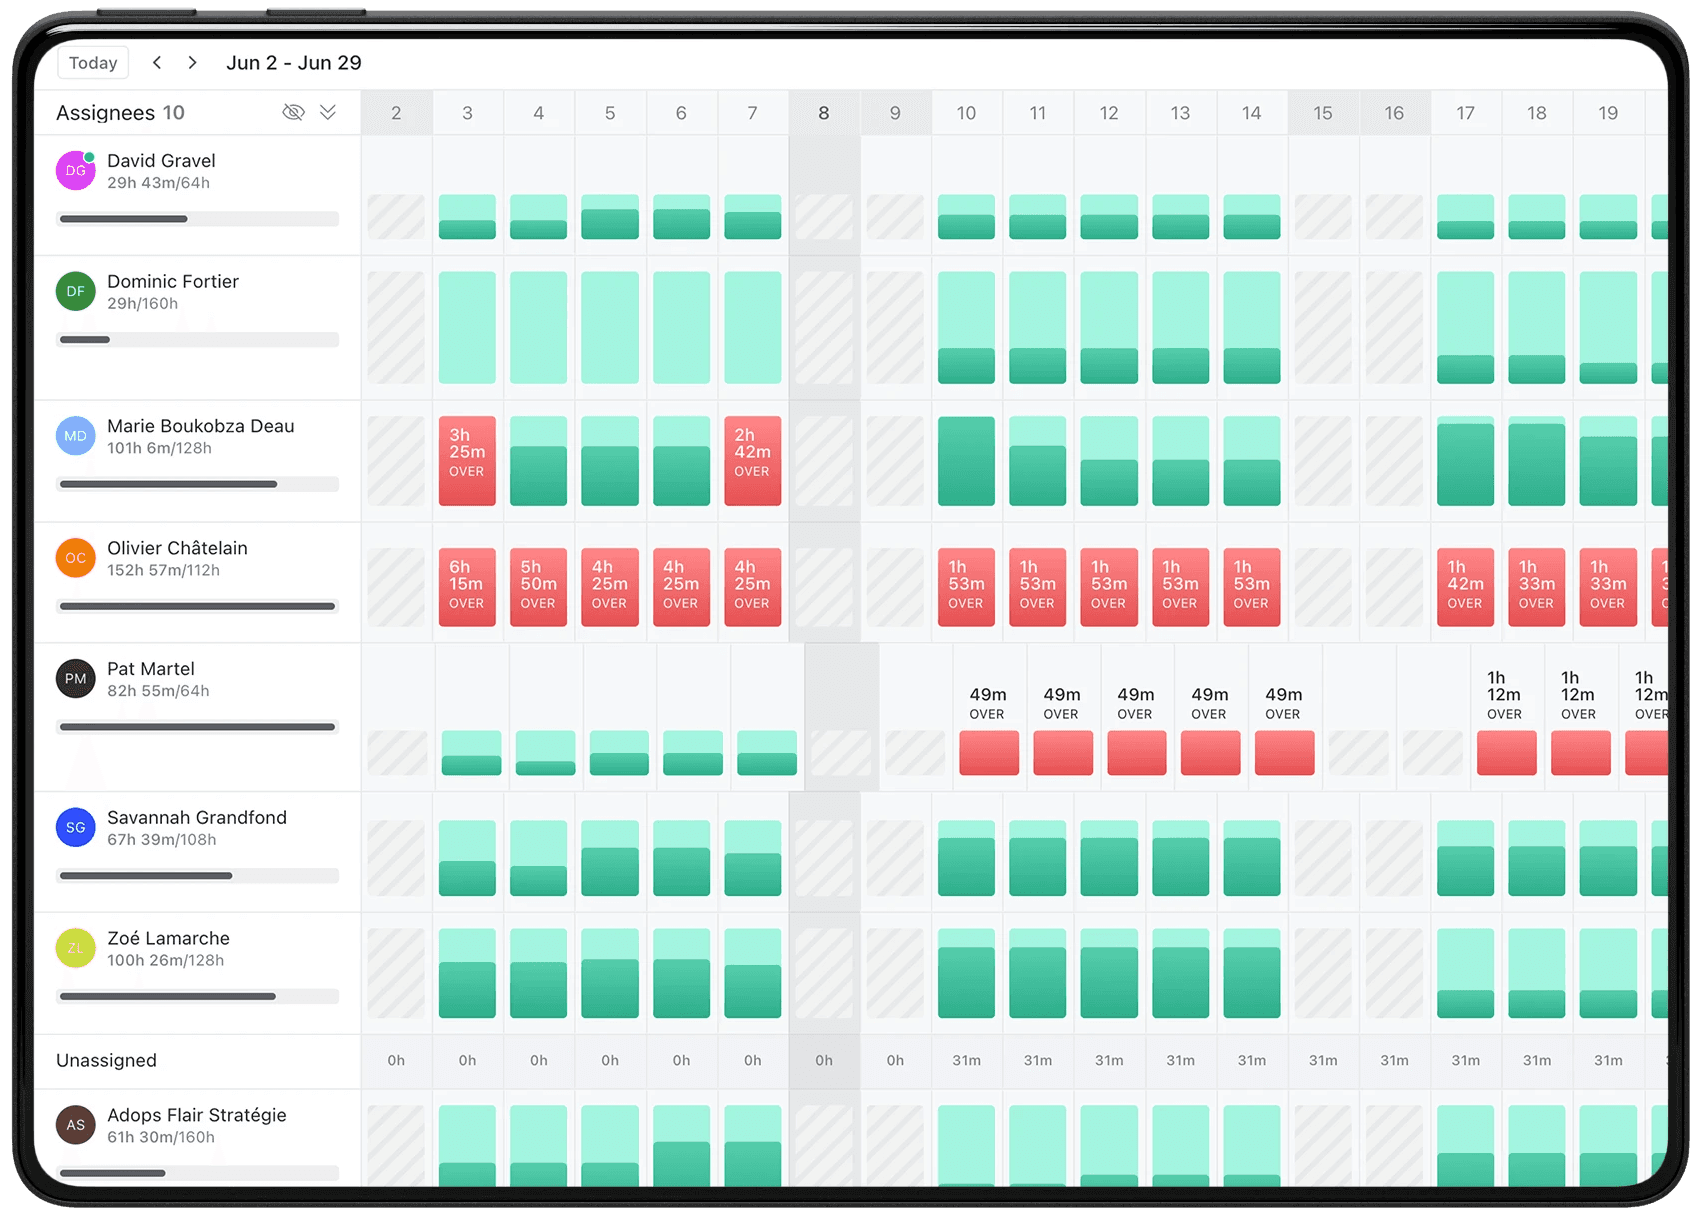
Obtaining precise workload time estimates weeks in advance for all employees helps managers make quick decisions to prevent staff from becoming overworked.
Task Progression
Monitor which tasks are in progress and which ones are not to gain a better understanding of which projects require attention.
Billable & Non-Billable
Assist employees in achieving a balance between their billable and non-billable hours by providing an accurate forecast of their daily workload.
Outsourcing Indicators
Obtain the necessary information to discern which tasks can be outsourced and which ones cannot.

Step 3
Analyzing the Performance

85%
Steady Billable Time
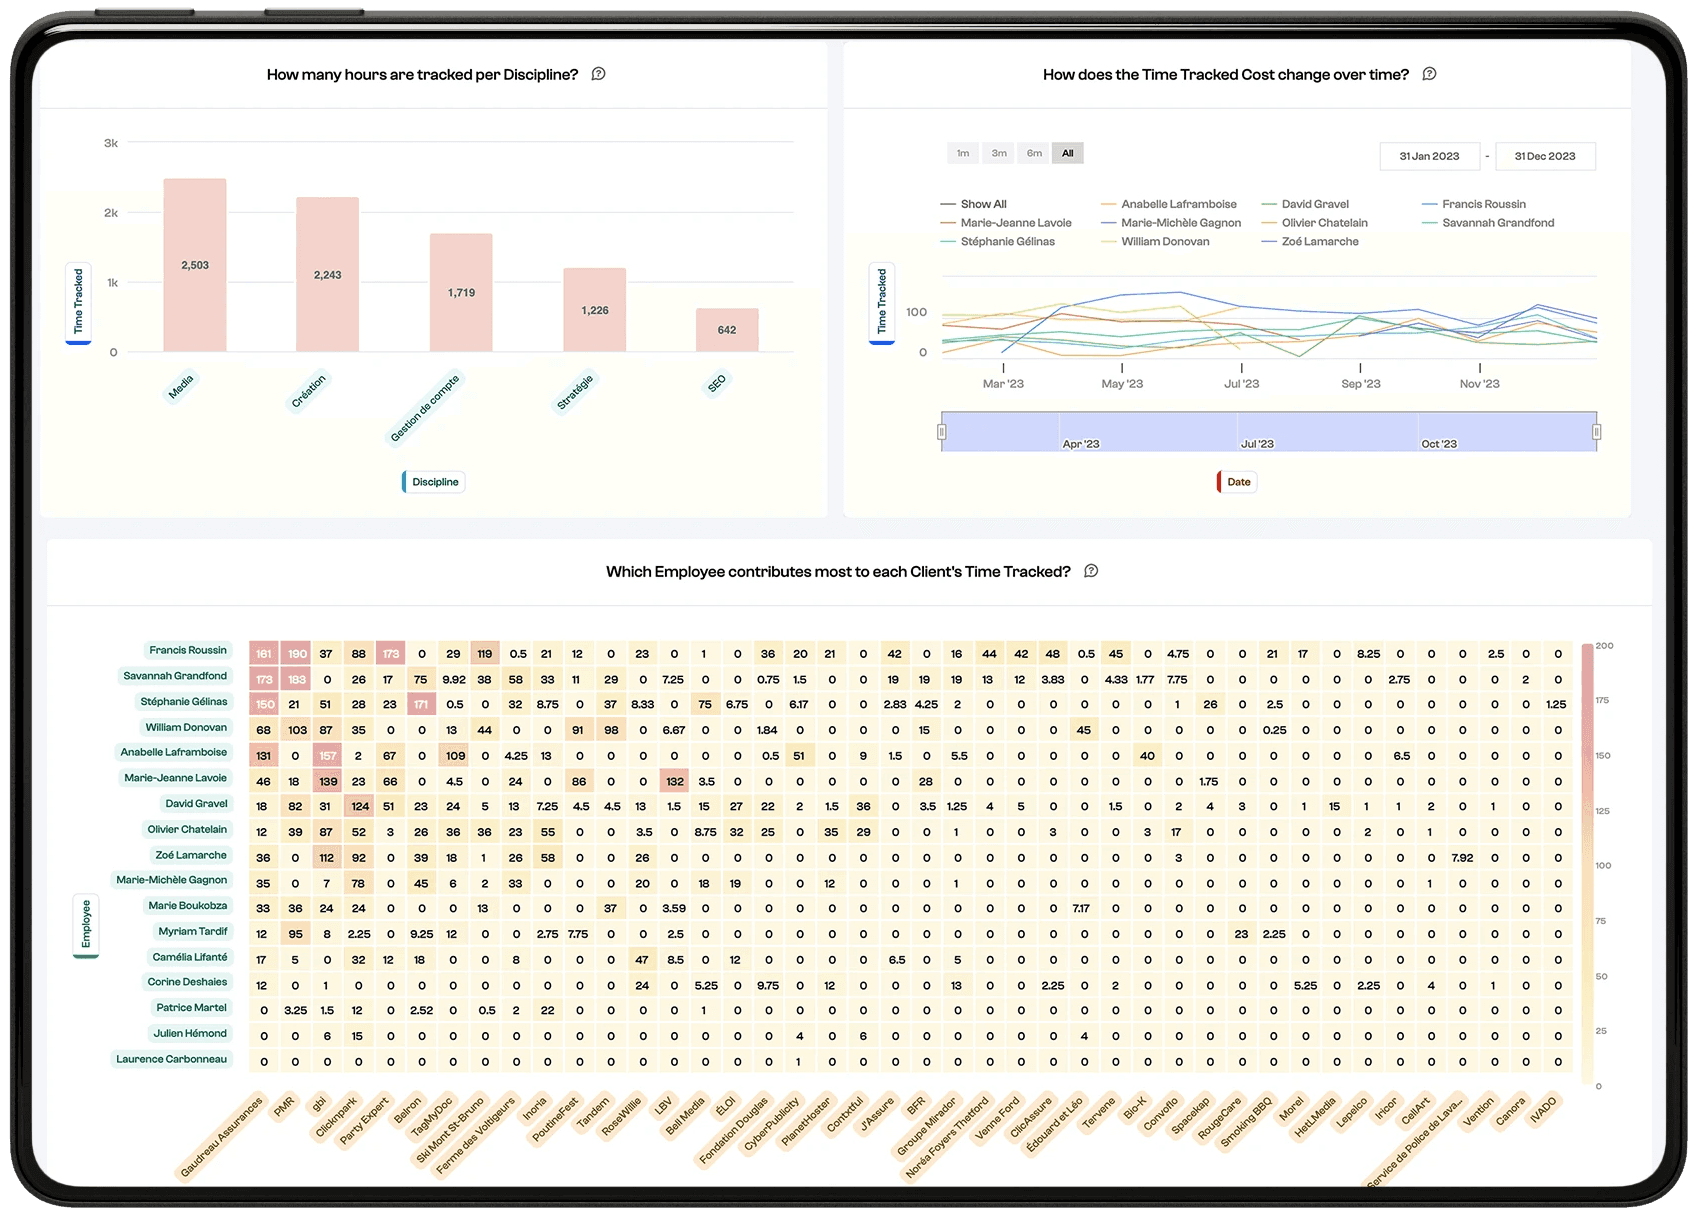
Accurate task distribution based on the costing grid, coupled with visibility into non-billable tasks, ensures that billable resources dedicate more time to revenue-generating work rather than non-billable meetings or tasks.
2x
Less Need for Subcontractors
Task labeling and tracking within the project management tool help ensure that we do not overutilize subcontractors for work that can be efficiently handled in-house.
60%
Consistent Profit Margin
This process aids in maintaining a consistent minimum profit margin across clients and projects.


